
Q2 2026 Price Update: Cherry Hills Village has seen the steepest decline (-23% YoY), while entry-level neighborhoods like Englewood and University Hills have held values within 3-4% of prior year. Updated medians below reflect Redfin/Zillow data as of March 2026.
Source: South Denver Guide —
View full size
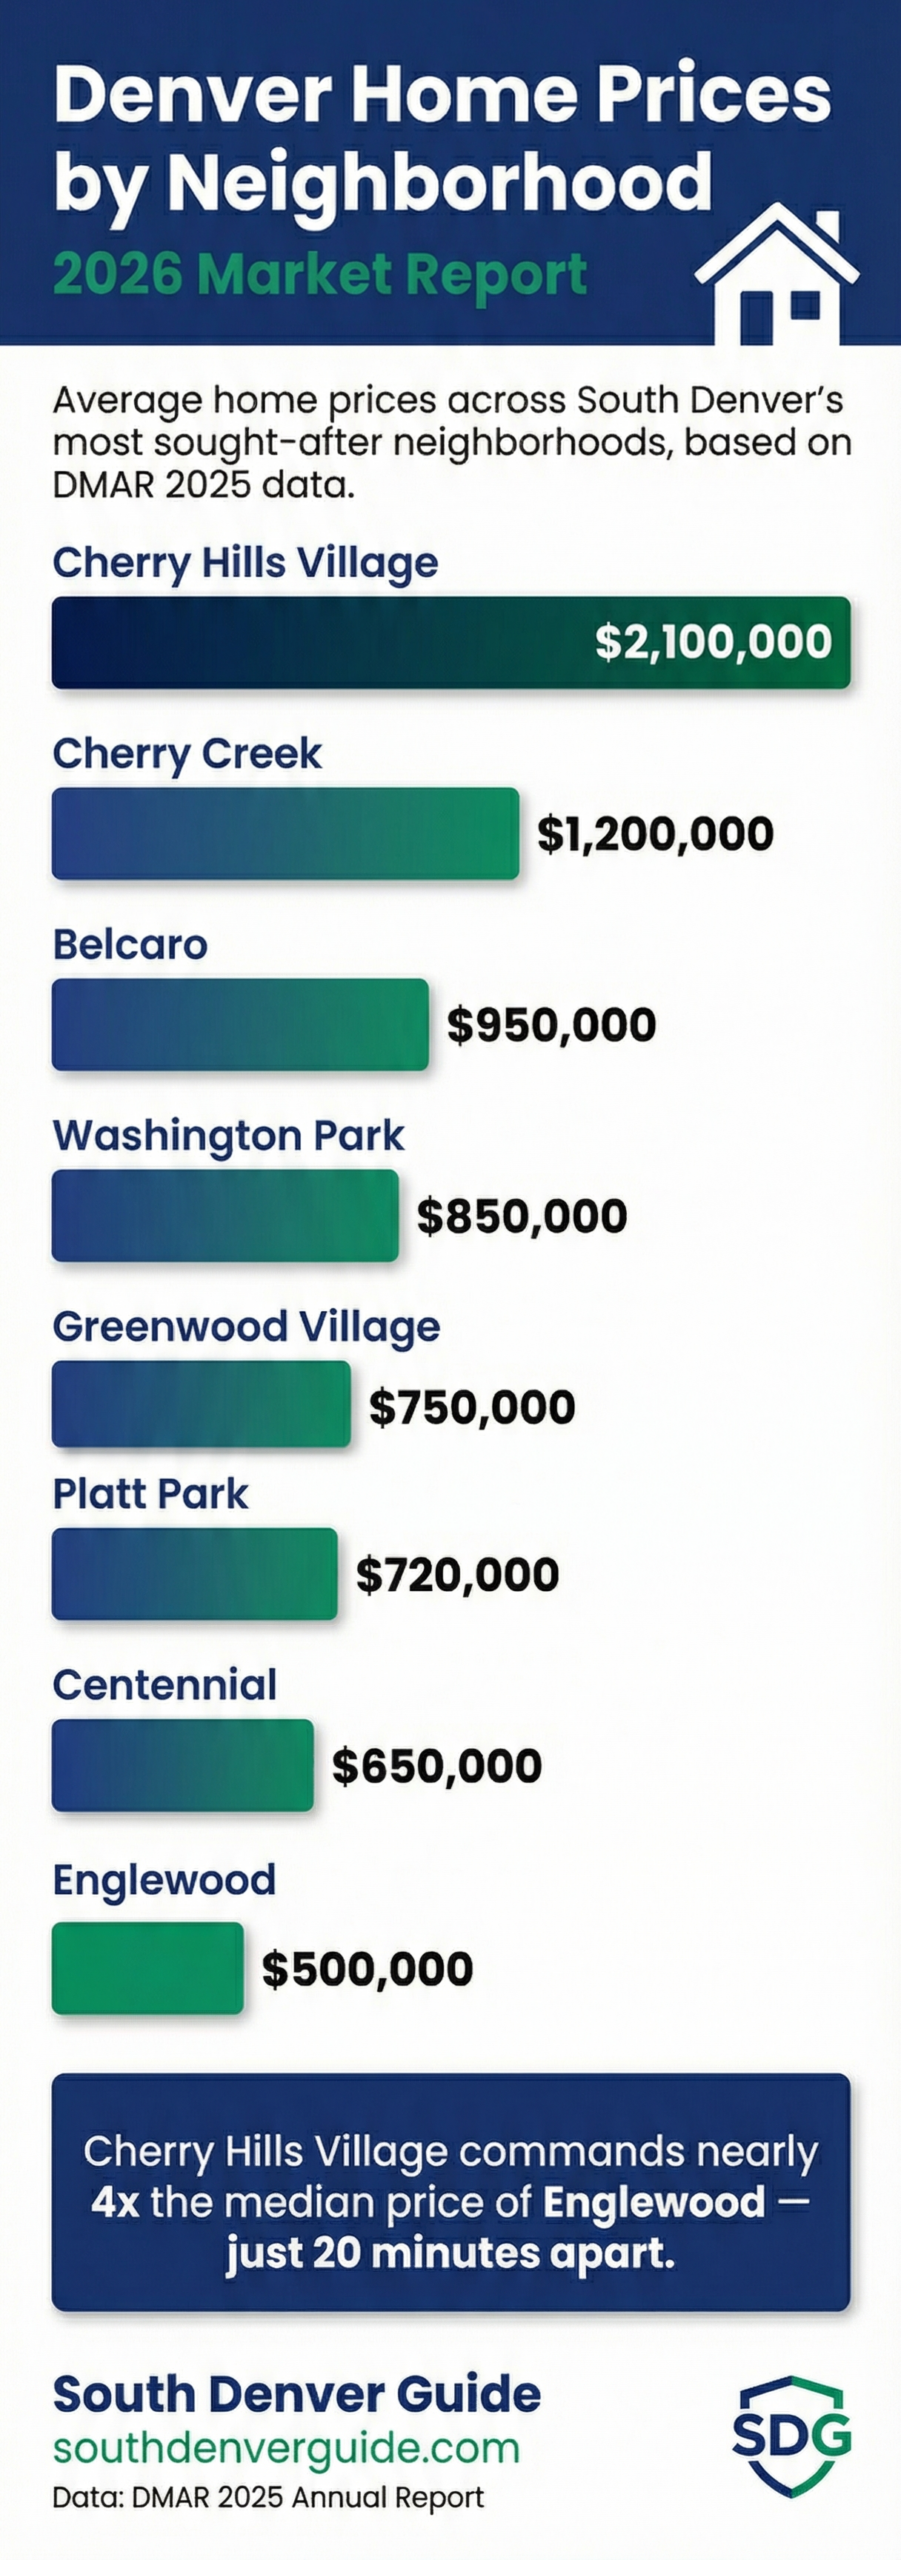
This infographic shows median home prices across South Denver’s most sought-after neighborhoods, updated with Q2 2026 Redfin and Zillow data. From Cherry Hills Village at $2.4M to Englewood at $539K, there’s a neighborhood for every buyer profile.
Key Takeaways (Q2 2026)
- Cherry Hills Village: $2.4M median — down 23% YoY. Ultra-luxury segment correcting fastest. Average $454/sqft.
- Cherry Creek: ~$850K median — down 5%. Walkable urban luxury lifestyle premium holding.
- Belcaro & Washington Park: $1.0-1.1M — established luxury and walkability premium stable.
- Greenwood Village & Centennial: $600-750K — best value in Cherry Creek School District.
- Englewood & University Hills: $539-580K — most resilient, down only 3-4% YoY.
- Metro-wide: $550K median (-2.7%), 80 avg DOM (+21%) — buyer’s market opening up.
Neighborhood Price Table (Q2 2026)
| Neighborhood | Q2 2026 Median | YoY Change | School District | Walk |
|---|---|---|---|---|
| Cherry Hills Village | $2,400,000 | -23% | Cherry Creek (9/10) | 2/10 |
| Belcaro | $1,100,000 | -4% | Denver Public (7/10) | 6/10 |
| Washington Park | $1,100,000 | -5% | Denver Public (7/10) | 9/10 |
| Cherry Creek | $850,000 | -5% | Denver Public (7/10) | 8/10 |
| Platt Park | $850,000 | -4% | Denver Public (7/10) | 7/10 |
| Bonnie Brae | $900,000 | -4% | Denver Public (7/10) | 7/10 |
| Greenwood Village | $750,000 | -3% | Cherry Creek (9/10) | 4/10 |
| Observatory Park | $650,000 | -3% | Denver Public (7/10) | 6/10 |
| Centennial | $600,000 | -3% | Cherry Creek (9/10) | 3/10 |
| Hampden South | $550,000 | -3% | Cherry Creek (8/10) | 5/10 |
| University Hills | $580,000 | -3% | Cherry Creek (8/10) | 4/10 |
| Englewood | $539,000 | -4% | Englewood (6/10) | 8/10 |
Sources: Redfin, Zillow (March 2026). Prices are approximate medians.
Download the Full Neighborhood Guide
Download South Denver Neighborhood Comparison Guide (Q2 2026)
12-page PDF | 11 neighborhoods fully profiled | Free download
Embed This Infographic
<div style="text-align:center;margin:20px 0;">
  <img src="https://www.southdenverguide.com/wp-content/uploads/2026/02/infographic-home-prices-2026-scaled.png" alt="Denver Home Prices by Neighborhood 2026" style="max-width:100%;height:auto;">
  <p style="font-size:12px;color:#666;margin-top:8px;">
    Source: <a href="https://southdenverguide.com/" target="_blank">South Denver Guide</a> —
    <a href="https://southdenverguide.com/denver-home-prices-by-neighborhood-2026/" target="_blank">View full size</a>
  </p>
</div>
Data sources: Redfin, Zillow (March 2026), Denver Metro Association of Realtors February 2026 Report.