Source: South Denver Guide —
View full size
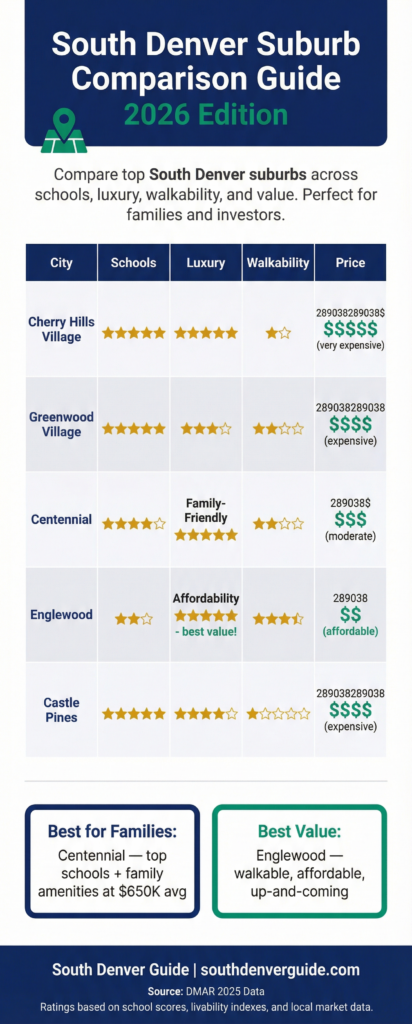
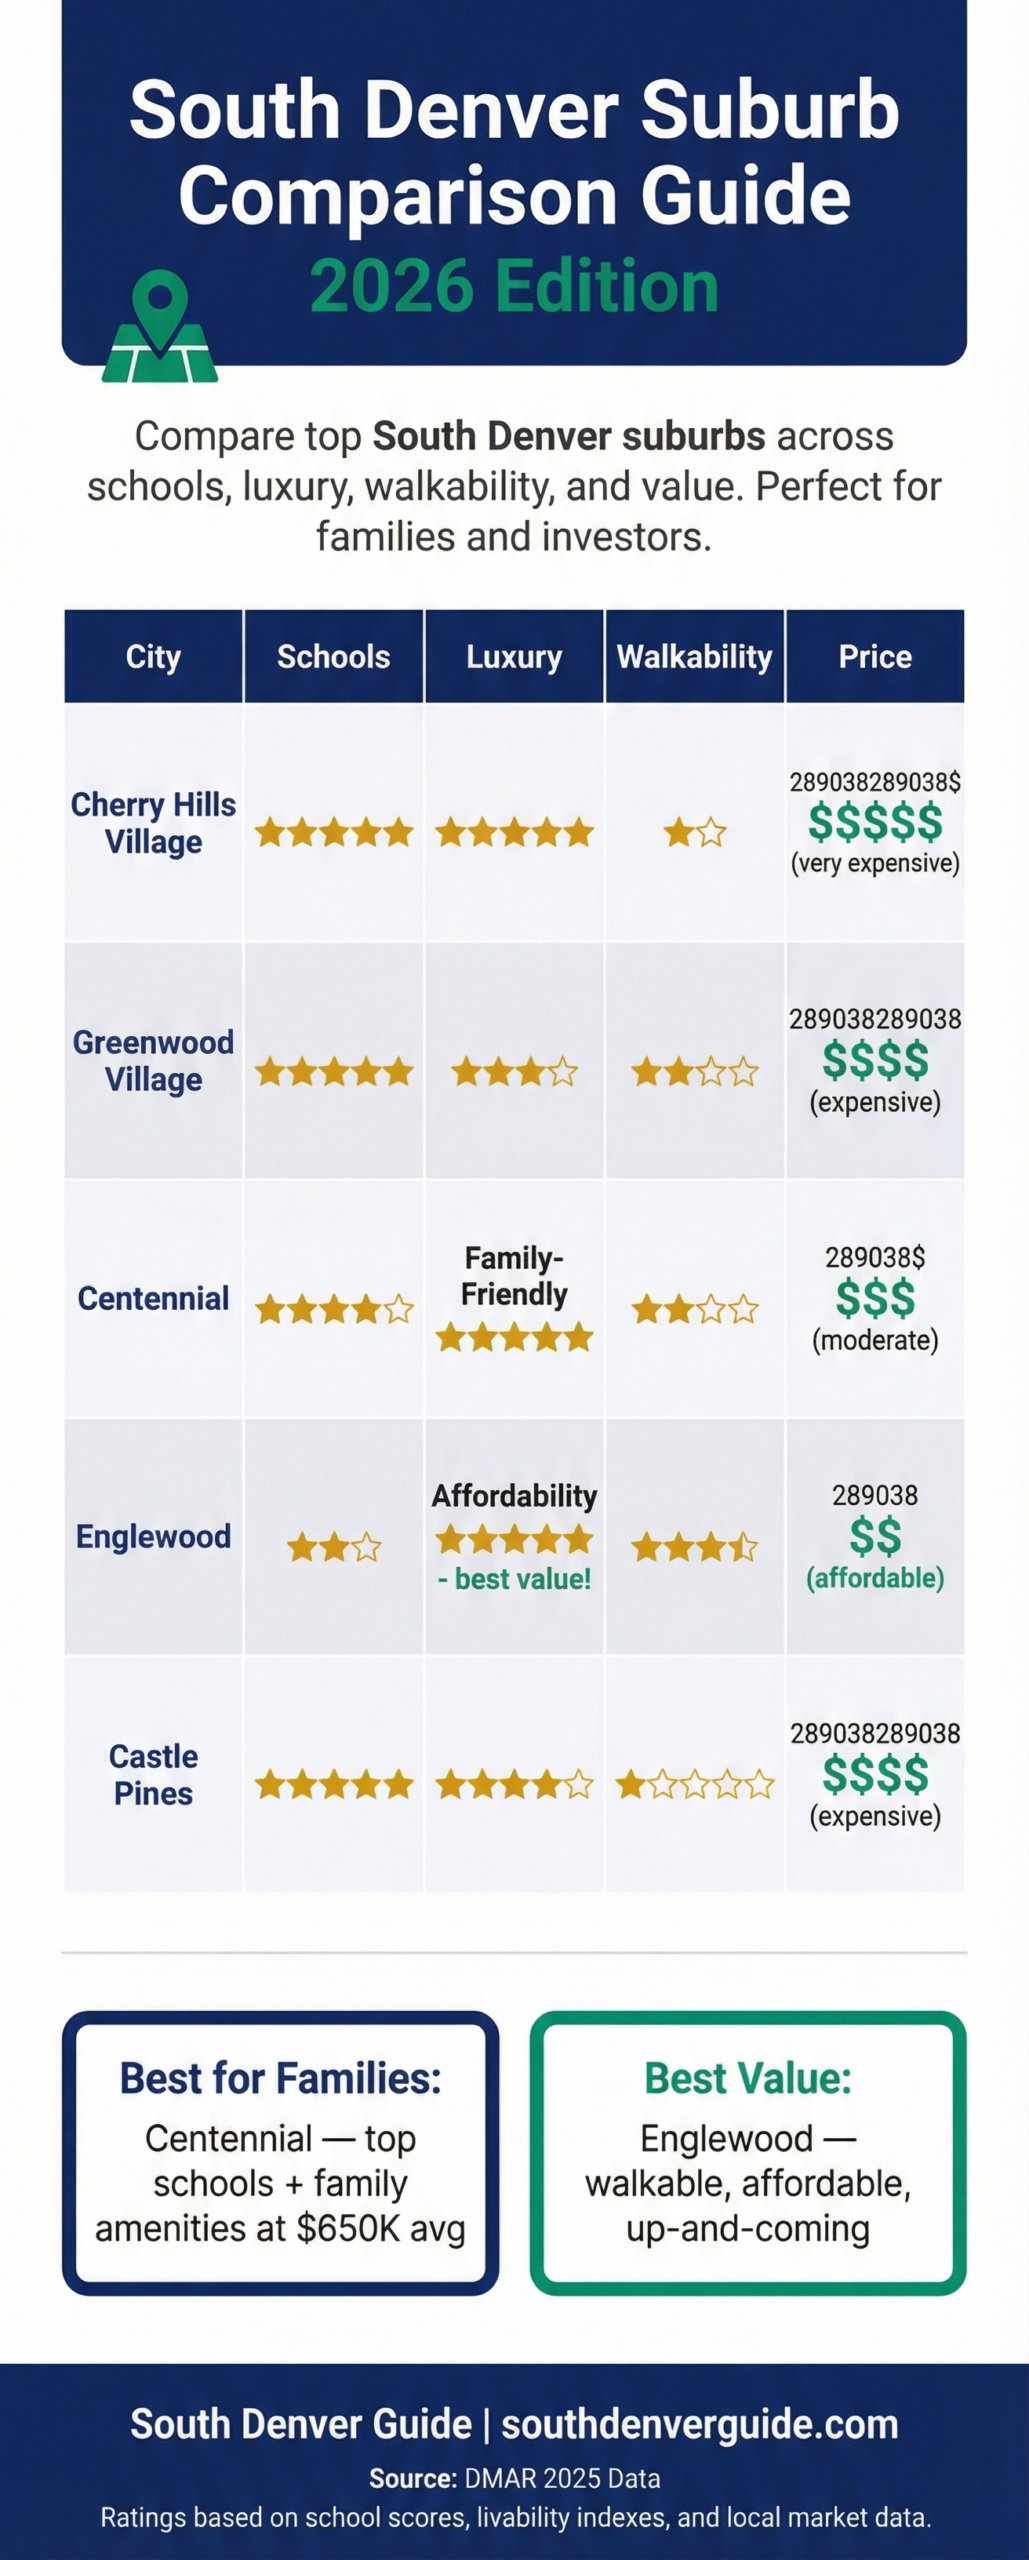
Choosing the right South Denver suburb means balancing schools, lifestyle, walkability, and price in a market that has shifted meaningfully in 2026. This comparison matrix rates eleven key South Denver neighborhoods.
Q2 2026 Market Context
- Metro Denver median sale price: $550,000 (-2.7% YoY) — Colorado Association of Realtors January 2026
- Average days on market: 80 days (+21% YoY) — significant increase in marketing time
- New listings: +2.2% YoY — more choices for buyers
- Closed sales: -14.6% YoY — longer path from listing to closing
- Cherry Hills Village median: $2.4M (-23% YoY) — ultra-luxury correction
- Englewood median: $539K (-4% YoY) — most resilient entry point
How We Rated Each Suburb
- Schools: GreatSchools ratings and state assessment scores (2025-2026 school year)
- Luxury/Amenities: High-end dining, shopping, and community facilities
- Walkability: Walk Score data and pedestrian infrastructure (2026 data)
- Price: Q2 2026 median sale prices per Redfin/Zillow (March 2026)
Top Picks for Q2 2026
- Best for Families: Centennial — top-rated Cherry Creek Schools + family amenities at ~$600K median
- Best Value: Englewood — walkable, light rail access, most resilient at $539K
- Most Luxurious: Cherry Hills Village — $2.4M median, down 23% — potential ultra-luxury entry point
- Most Walkable: Washington Park (9/10) and Englewood (8/10)
- Best Investment: Observatory Park and Englewood — up-and-coming with improving fundamentals
Download the Full Neighborhood Guide
Get the complete 12-page neighborhood-by-neighborhood breakdown with Q2 2026 prices, school ratings, walkability scores, and commute times for all 11 South Denver neighborhoods.
Download South Denver Neighborhood Comparison Guide (Q2 2026)
12-page PDF | 11 neighborhoods fully profiled | Free download
Embed This Infographic
Free to use with attribution. Copy the code below:
<div style="text-align:center;margin:20px 0;">
  <img src="https://www.southdenverguide.com/wp-content/uploads/2026/02/infographic-suburb-comparison-2026-scaled.png" alt="South Denver Suburb Comparison Guide 2026" style="max-width:100%;height:auto;">
  <p style="font-size:12px;color:#666;margin-top:8px;">
    Source: <a href="https://southdenverguide.com/" target="_blank">South Denver Guide</a> —
    <a href="https://southdenverguide.com/south-denver-suburb-comparison-guide-2026/" target="_blank">View full size</a>
  </p>
</div>
Data sources: Redfin, Zillow, Colorado Association of Realtors January 2026 Report, GreatSchools.org, Walk Score. Prices represent Q2 2026 medians.