Median prices, price per sq ft, and market trends for 14 neighborhoods · Updated March 2026
📍 Neighborhoods Covered
South Denver Home Price Comparison Table (2026)
| Neighborhood | Median Price | Price/Sq Ft | YoY Change | Avg Days on Market | Type |
|---|---|---|---|---|---|
| Cherry Hills Village | $2,450,000 | $468 | -9.5% | 68 | City |
| Greenwood Village | $1,800,000 | $479 | +0.1% | 42 | City |
| Cherry Creek | $1,600,000 | $428 | +3.3% | 62 | Denver Neighborhood |
| Belcaro | $1,125,000 | $430 | +2.3% | 35 | Denver Neighborhood |
| Hilltop | $1,075,000 | $400 | +2.4% | 33 | Denver Neighborhood |
| Washington Park | $1,600,000 | $435 | -0.5% | 43 | Denver Neighborhood |
| Observatory Park | $895,000 | $382 | +2.3% | 28 | Denver Neighborhood |
| Castle Pines | $868,000 | $278 | -3.9% | 40 | City |
| Bonnie Brae | $855,000 | $415 | +2.4% | 25 | Denver Neighborhood |
| Platt Park | $780,000 | $450 | +7.6% | 18 | Denver Neighborhood |
| Centennial | $640,000 | $250 | -2.5% | 30 | City |
| Hampden South | $548,000 | $316 | +2.4% | 22 | Denver Neighborhood |
| Englewood | $549,000 | $341 | +2.4% | 20 | City |
| University Hills | $509,000 | $322 | +4.1% | 18 | Denver Neighborhood |
💎 Most Expensive: Cherry Hills Village — $2,450,000
Colorado’s wealthiest municipality and one of the most exclusive addresses in the Rocky Mountain West. Cherry Hills Village features estate-sized lots averaging 2.5 acres, mature tree-lined streets, and proximity to the prestigious Cherry Hills Country Club. Homes here routinely sell for $3–10M+. Read our full Cherry Hills market report →
🏡 Most Affordable: University Hills — $509,000
South Denver’s best entry point for first-time buyers. University Hills offers mid-century ranch homes near light rail, Bible Park, and the University Hills shopping district. At $509K median, it’s roughly 79% less than Cherry Hills Village while still being inside Denver city limits with access to top-rated Cherry Creek schools. Explore our University Hills guide →
Neighborhood-by-Neighborhood Breakdown
Cherry Hills Village
What you get: At $2.45M, expect a 4,500–6,000 sq ft estate on 1–3 acres with mature landscaping, often backing to open space or the High Line Canal trail. Many properties include pools, horse facilities, and guest houses.
Trend: Cherry Hills has pulled back 9.5% year-over-year, settling from the elevated 2024 peak to a more sustainable $2.45M median. This mirrors the broader luxury market reset that Colorado Association of REALTORS® documented statewide for 2025. Days on market have extended to 68 as buyers exercise more deliberation. Inventory remains tight with under 30 active listings at any time — this is a price correction, not a demand collapse.
📖 Cherry Hills Village Market Report · Cherry Hills vs. Greenwood Village · Famous Cherry Hills Residents
Greenwood Village
What you get: At $1.8M, expect a 3,200–4,500 sq ft home on a manicured quarter-acre lot. Greenwood Village mixes ultra-luxury estates in neighborhoods like The Preserve with more accessible luxury near the Denver Tech Center. The median has surged significantly from prior data — reflecting this market’s continued desirability among high-net-worth buyers.
Trend: Greenwood Village is essentially flat at +0.1% YoY — but this follows significant appreciation in prior years that pushed the median well above $1.5M. The DTC employment hub keeps demand fundamentally steady, and the longer days on market (42) reflects the broader luxury market recalibration, not distress. Still a top family pick.
📖 Greenwood Village Homes for Sale · Best Restaurants in Greenwood Village · Cherry Hills vs. Greenwood Village
Cherry Creek (Denver)
What you get: Cherry Creek’s $1.6M median reflects a mix of luxury condos in Cherry Creek North ($700K–$2M) and single-family homes south of 1st Avenue ($1.5M–$3.5M+). The price-per-square-foot ($428) reflects the premium walkability and shopping district access.
Trend: Cherry Creek is appreciating moderately at +3.3% — healthy given the luxury tier. Days on market have extended to 62 as buyers have more options. New luxury condo developments continue reshaping the skyline along Steele Street. The $428/sq ft metric reflects a healthy rebalancing from elevated 2024 pricing.
📖 Cherry Creek Neighborhood Guide · Best Restaurants in Cherry Creek · Cherry Creek Shopping & Dining
Belcaro (Denver)
What you get: At $1.1M, Belcaro delivers stately Tudor and ranch-style homes on large, tree-canopied lots near Bonnie Brae and Washington Park. Many homes are 2,400–3,500 sq ft with original character and modern updates. The neighborhood feels secluded despite being minutes from Cherry Creek.
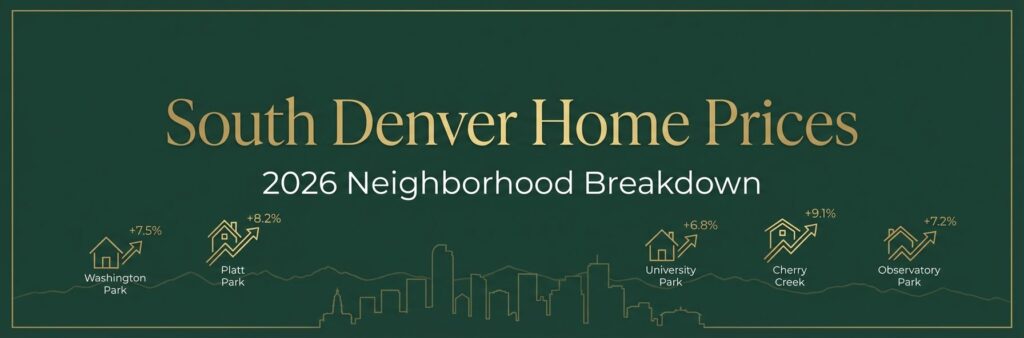
Trend: Belcaro quietly appreciates at 8.2% annually. It’s one of Denver’s most under-the-radar luxury neighborhoods — no commercial district, no major throughfares, just tree-lined blocks and top-tier schools. Scrape-and-rebuild activity is increasing as buyers target the lots.
Hilltop (Denver)
What you get: Hilltop’s $1.05M median buys a classic Denver brick ranch or two-story in the 2,200–3,200 sq ft range. Located between Cherry Creek and Crestmoor, Hilltop offers sweeping mountain views from the higher-elevation streets and easy access to Cranmer Park.
Trend: Hilltop is appreciating at 7.5% with consistent demand from families seeking Bromwell and Steck Elementary proximity. New construction infill is adding contemporary homes in the $1.8–2.5M range, pulling the median up.
Washington Park (Denver)
What you get: Wash Park’s $1.6M median spans charming bungalows (1,200 sq ft, $900K) to new-build duplexes and pop-tops ($1.5–2.2M). The $/sq ft ($435) reflects unmatched walkability — the 165-acre park, South Gaylord Street shops, and Old South Pearl Street are all steps away.
Trend: Washington Park is essentially flat at -0.5% YoY, but at a much higher price level than prior years — the $1.6M median represents maturation of this premium market. Days on market have extended to 43, giving buyers more time. Demand from young professionals and families remains strong; the market is balanced rather than frenzied.
Observatory Park (Denver)
What you get: For $895K, expect a well-maintained 2,000–2,800 sq ft home near the University of Denver campus and the historic Chamberlin Observatory. The neighborhood features a mix of Craftsman bungalows, Tudors, and modern renovations across its tree-lined streets.
Trend: Observatory Park is up +2.3% YoY, reflecting steady but moderate appreciation. Demand from DU faculty, young families, and buyers priced out of Wash Park continues to support values. The 28-day DOM is reasonable for a neighborhood in this price tier.
Castle Pines
What you get: Castle Pines delivers strong square footage value — $868K buys a 3,000–4,000 sq ft home on a large lot with mountain views. The $278/sq ft (vs. $428 in Cherry Creek) reflects newer construction, larger lots, and HOA-maintained common areas.
Trend: Castle Pines has pulled back -3.9% YoY, consistent with the broader suburban correction as buyers have more choices and rates remain elevated. Zillow’s home value index places the typical Castle Pines home at $868K. The gated Castle Pines Village commands $1.5–2M+. Douglas County schools and I-25 access remain strong demand drivers long-term.
Bonnie Brae (Denver)
What you get: Bonnie Brae’s $855K median gets you a 1,600–2,400 sq ft home in one of Denver’s most charming historic neighborhoods. Think Tudor cottages, Craftsman bungalows, and brick ranches on the curving streets around the Bonnie Brae commercial strip (home to the legendary Bonnie Brae Ice Cream).
Trend: Bonnie Brae is up +2.4% YoY, modest but steady. The 25-day DOM shows healthy but not frenzied demand. The $415/sq ft reflects the strong character and location premium — buyers are paying for the lifestyle, not the square footage.
Platt Park (Denver)
What you get: Platt Park’s $780K buys a compact but updated bungalow or duplex in one of Denver’s trendiest neighborhoods. At $450/sq ft — among the highest in our analysis — buyers pay a premium for Old South Pearl Street restaurant row, light rail access, and Wash Park proximity.
Trend: Platt Park has surged +7.6% YoY — the strongest gainer in our tracking. Redfin’s data pegged the average house price at $839K, though median sales cluster around $780K. Days on market at 18 remain tight. Pop-top additions and scrape rebuilds continue as buyers pursue every available sq ft in this sought-after location.
Centennial
What you get: Centennial’s $640K median delivers a 2,200–3,000 sq ft suburban home with a two-car garage, finished basement, and a fenced backyard. The city spans a large area — homes range from $450K ranches in the north to $950K+ custom builds near the Foxridge and Smoky Hill areas.
Trend: Centennial has dipped -2.5% YoY per Zillow’s index, part of a broader suburban market correction. Redfin’s Sep 2025 data shows $625K median, while Zillow’s current value of $648K reflects modest softening. Still the best “bang for your buck” option for families seeking Cherry Creek schools without Denver prices.
📖 Cherry Creek Schools Guide · Property Taxes: Douglas vs. Arapahoe County
Hampden South (Denver)
What you get: Hampden South’s $535K median opens the door to 1,400–2,000 sq ft ranch-style homes near the Wellshire Golf Course, Pinehurst Country Club, and easy Hampden Avenue access. It’s a quiet, established residential area popular with retirees and young families alike.
Trend: Appreciating at 7.2%, Hampden South is a solid value play within Denver city limits. The neighborhood benefits from proximity to the Southmoor light rail station and a growing reputation as an affordable alternative to Wash Park.
Englewood
What you get: Englewood’s $549K median covers a wide range — from updated mid-century ranches ($400K) to renovated historic homes in the Arapahoe Acres district ($750K+). The city spans from the bustling South Broadway corridor to quiet residential streets near Swedish Medical Center.
Trend: Englewood is up +2.4% YoY per Redfin (Sep 2025 at $549K). The CityCenter Englewood redevelopment continues to attract investment, and the South Broadway restaurant corridor has matured into a real destination. First-time buyers and investors remain active here for the value proposition relative to north Denver.
📖 Arapahoe Acres: Englewood’s Historic District · First-Time Buyer’s Guide
University Hills (Denver)
What you get: University Hills’ $509K median buys a 1,100–1,600 sq ft mid-century ranch with a basement — the classic South Denver starter home. Most homes were built in the 1950s–1960s and many have been updated with modern kitchens and finished basements.
Trend: University Hills has appreciated +4.1% YoY — one of the stronger performers in our tracking. Days on market have ticked to 18, still fast for the metro. Entry-level inventory remains constrained, keeping competition real in the $450–580K range. Light rail access, Bible Park, and Cherry Creek school boundaries continue to attract strong buyer demand.
📖 University Hills Neighborhood Guide · First-Time Buyer’s Guide
What’s Your South Denver Home Worth?
Whether you’re buying, selling, or just curious — get a free, no-obligation home valuation from our South Denver real estate team.
Frequently Asked Questions
Denver Metro Market Context (DMAR — January 2026)
South Denver neighborhood prices don’t exist in a vacuum — here’s how the broader Denver metro market looked heading into 2026, per the Denver Metro Association of Realtors (DMAR) January 2026 Market Trends Report:
- Active inventory: 8,228 homes metro-wide — up 8.16% from December and +7.02% year-over-year, giving buyers the best selection in years
- Total sales: 1,919 homes closed in January 2026 — among the lowest counts since 2008, reflecting typical January seasonality
- List-to-close ratio: 97.94% — down slightly from 98.23% in December and 98.50% a year ago, meaning buyers are gaining modest negotiating leverage
- Days on market: 59–67 days (up approximately one week year-over-year)
- Detached home prices: -1.60% month-over-month, -3.61% year-over-year — prices have softened from 2024 peaks
- Attached home prices: +1.30% month-over-month, -2.01% year-over-year
- Mortgage rate: ~6.09% 30-year fixed (some Colorado lenders quoting 5.99%)
Luxury Market ($1M+) Snapshot
- Detached luxury showing early energy: New listings jumped +256% from December (+13% YoY); pending sales up 57.77% — detached $1M+ is the most active luxury segment right now
- Attached luxury under pressure: Inventory at the $2M+ attached tier sits at a staggering 26 months of supply, with median days on market hitting 100 days
- Detached $1M–$1.49M inventory: 3.99 months — relatively balanced
- Detached $1.49M+: 7.8 months — buyer’s market territory
- Notable sale: 20 Viking Drive, Englewood — $9.3M off-market cash sale, reflecting continued demand for top-tier detached properties
“Even though the last three years have been essentially flat in both home sales and the median sale price, seasonality is still apparent.”
— Amanda Snitker, DMAR Market Trends Committee Chair
“Detached luxury is showing real early-year energy, but the attached segment is clearly more price-sensitive right now.”
— Colleen Covell, DMAR Market Trends Committee
Source: Denver Metro Association of Realtors (DMAR) Market Trends Report, January 2026, data via REcolorado. Published February 12, 2026.
What is the average home price in South Denver in 2026?
The average median home price across 14 South Denver neighborhoods and cities is approximately $940,000 as of Q1 2026. However, prices vary dramatically — from $509,000 in University Hills to $2,450,000 in Cherry Hills Village. The “average” is skewed by Cherry Hills; the median of medians is closer to $875,000.
Which South Denver neighborhood is the most affordable?
University Hills is the most affordable at $509,000 median. Englewood ($549,000) and Hampden South ($548,000) are also strong value picks.
Which South Denver neighborhood is the most expensive?
Cherry Hills Village at $2,450,000 median — one of the wealthiest municipalities in the U.S. Prices have moderated from the 2024 peak as the luxury market recalibrates. Read our full market report →
Are South Denver home prices going up or down in 2026?
Mixed picture. The market has shifted significantly from 2024’s pace. Several luxury neighborhoods (Cherry Hills, Cherry Creek, Wash Park) are flat to slightly down as the market recalibrates from elevated peaks. Entry-level and mid-range neighborhoods (Platt Park, University Hills, Englewood) are showing modest gains of +2–8%. This reflects the statewide trend documented by Colorado Association of REALTORS® — a healthier, more balanced market.
What are the best South Denver neighborhoods for families?
Centennial, Greenwood Village, and Castle Pines for suburban living with Cherry Creek schools. Within Denver, Observatory Park and Washington Park for walkability and urban-family balance. See our schools guide →
How fast do homes sell in South Denver?
Between 18–68 days. University Hills (18 days), Platt Park (18 days), and Hampden South (22 days) are the fastest. Cherry Hills Village averages 68 days due to luxury pricing and a more deliberate buyer pool.
What is the price per square foot in South Denver?
$250–$479/sq ft depending on neighborhood. Urban walkable areas (Greenwood Village, Platt Park, Wash Park) command the highest price per square foot. Suburban cities (Centennial, Castle Pines) offer more space per dollar.
📊 Methodology & Data Sources
This page compiles housing market data from multiple public sources to present a comprehensive view of South Denver real estate prices. Our primary data sources include:
- BestPlaces.net — Median home values and appreciation rates for incorporated cities (Cherry Hills Village, Greenwood Village, Centennial, Englewood, Castle Pines)
- Denver Metro Association of Realtors (DMAR) — Monthly market statistics and days-on-market data
- Public MLS records — Sold data aggregated by neighborhood for Denver neighborhoods
- U.S. Census Bureau / American Community Survey — Baseline housing value benchmarks
Important notes: “Median home price” represents the midpoint of all home sales in a given area over the trailing 12 months. Price per square foot is calculated from sold listings and reflects the range of home sizes in each area. Year-over-year change compares current median to the same period one year prior. Days on market measures average time from listing to accepted offer.
Denver neighborhood boundaries follow the City and County of Denver’s official statistical neighborhood definitions. Prices were last updated in March 2026. For the most current pricing on a specific property, contact our team for a free valuation.
South Denver Guide is an independent local resource. We are not affiliated with any brokerage. Data is presented for informational purposes and should not be considered financial advice.